


 94 / 114

[
] 92
youth (aged 19-30); adults (aged 31-55); senior citizens
(aged 56 and above); and disabled people. Focus group
discussion questions included:
• What are the issues/problems you experience?
• Why do these issues/problems occur?
• How can these issues/problems be resolved?
Residents voted based on a ‘priority needs’ list that emerged
from the focus group discussions. Each individual (including
residents aged 10 years and above for housing projects) was
given ballots to vote for their prioritized items.
Step two used the outcomes of step one for planning and
budgeting. Decisions were based on project feasibility, techni-
cal considerations and budget availability. Step three was the
implementation of the project, and in step four the project was
monitored and evaluated.
Project one: housing
Project one was a housing project at two low-cost apartment
complexes owned and managed by MPSP and MBPP. Projek
Perumahan Rakyat (PPR) Jalan Sungai comprises two 22-storey
blocks housing 529 three-bedroom units, and PPR Ampangan
is a 10-storey block of 250 low-cost three-bedroom units. Each
block has an average rental of RM110 (US$35) a month.
The project started with a household survey to get informa-
tion on the background of the residents. Women formed the
majority of residents in both places, at 53.5 per cent in PPR
Jalan Sungai and 53.4 per cent in Ampangan. The numbers
for each focus group discussion were planned (based on the
information compiled in step one), to ensure diversity in repre-
sentation of gender, age and ethnicity in both PPRs. Special
interactive sessions with children aged 10-13 sought to create
awareness and educate the children about gender issues in their
homes and surroundings through drawing and colouring.
Overall more women, many of them housewives, aged 31-55
attended the focus group discussions than men and women
from other age groups. Through the discussions, a list of the
residents’ important needs was compiled and classified accord-
ing to themes, projects and programmes that the community
could work on in their own apartment complexes. All residents
aged 10 and above were eligible to vote. An encouraging 69.5
per cent of the 1,667 PPR Jalan Sungai residents and 67.5 per
cent of the 886 PPR Ampangan residents who were eligible
participated in the voting process. At the end of the three-day
voting process, most PPR Jalan Sungai residents chose build-
ing maintenance as their top concern, while PPR Ampangan
residents voted for a recreational park as their highest priority.
The project planning, budgeting and implementation
proved to be the most challenging as it stretched to over 10
months of numerous consultations among local councils, resi-
dents and the GRB team. This was because of the technicality
of implementation, which had to follow standard procedures
laid down by local councils, as well as internal problems
within the communities.
Project two: Campbell Street Market rejuvenation
In 2015 the GRPB methodology was tested out in MBPP
and MPSP public facilities projects that involved a much
wider community. In the past, the method would be to get
architects/planners to propose designs based on general
specifications and recommendations made by MBPP in the
tender documents. However, for this project MBPP decided
to implement the GRPB process and duly sought the help
and involvement of PWDC.
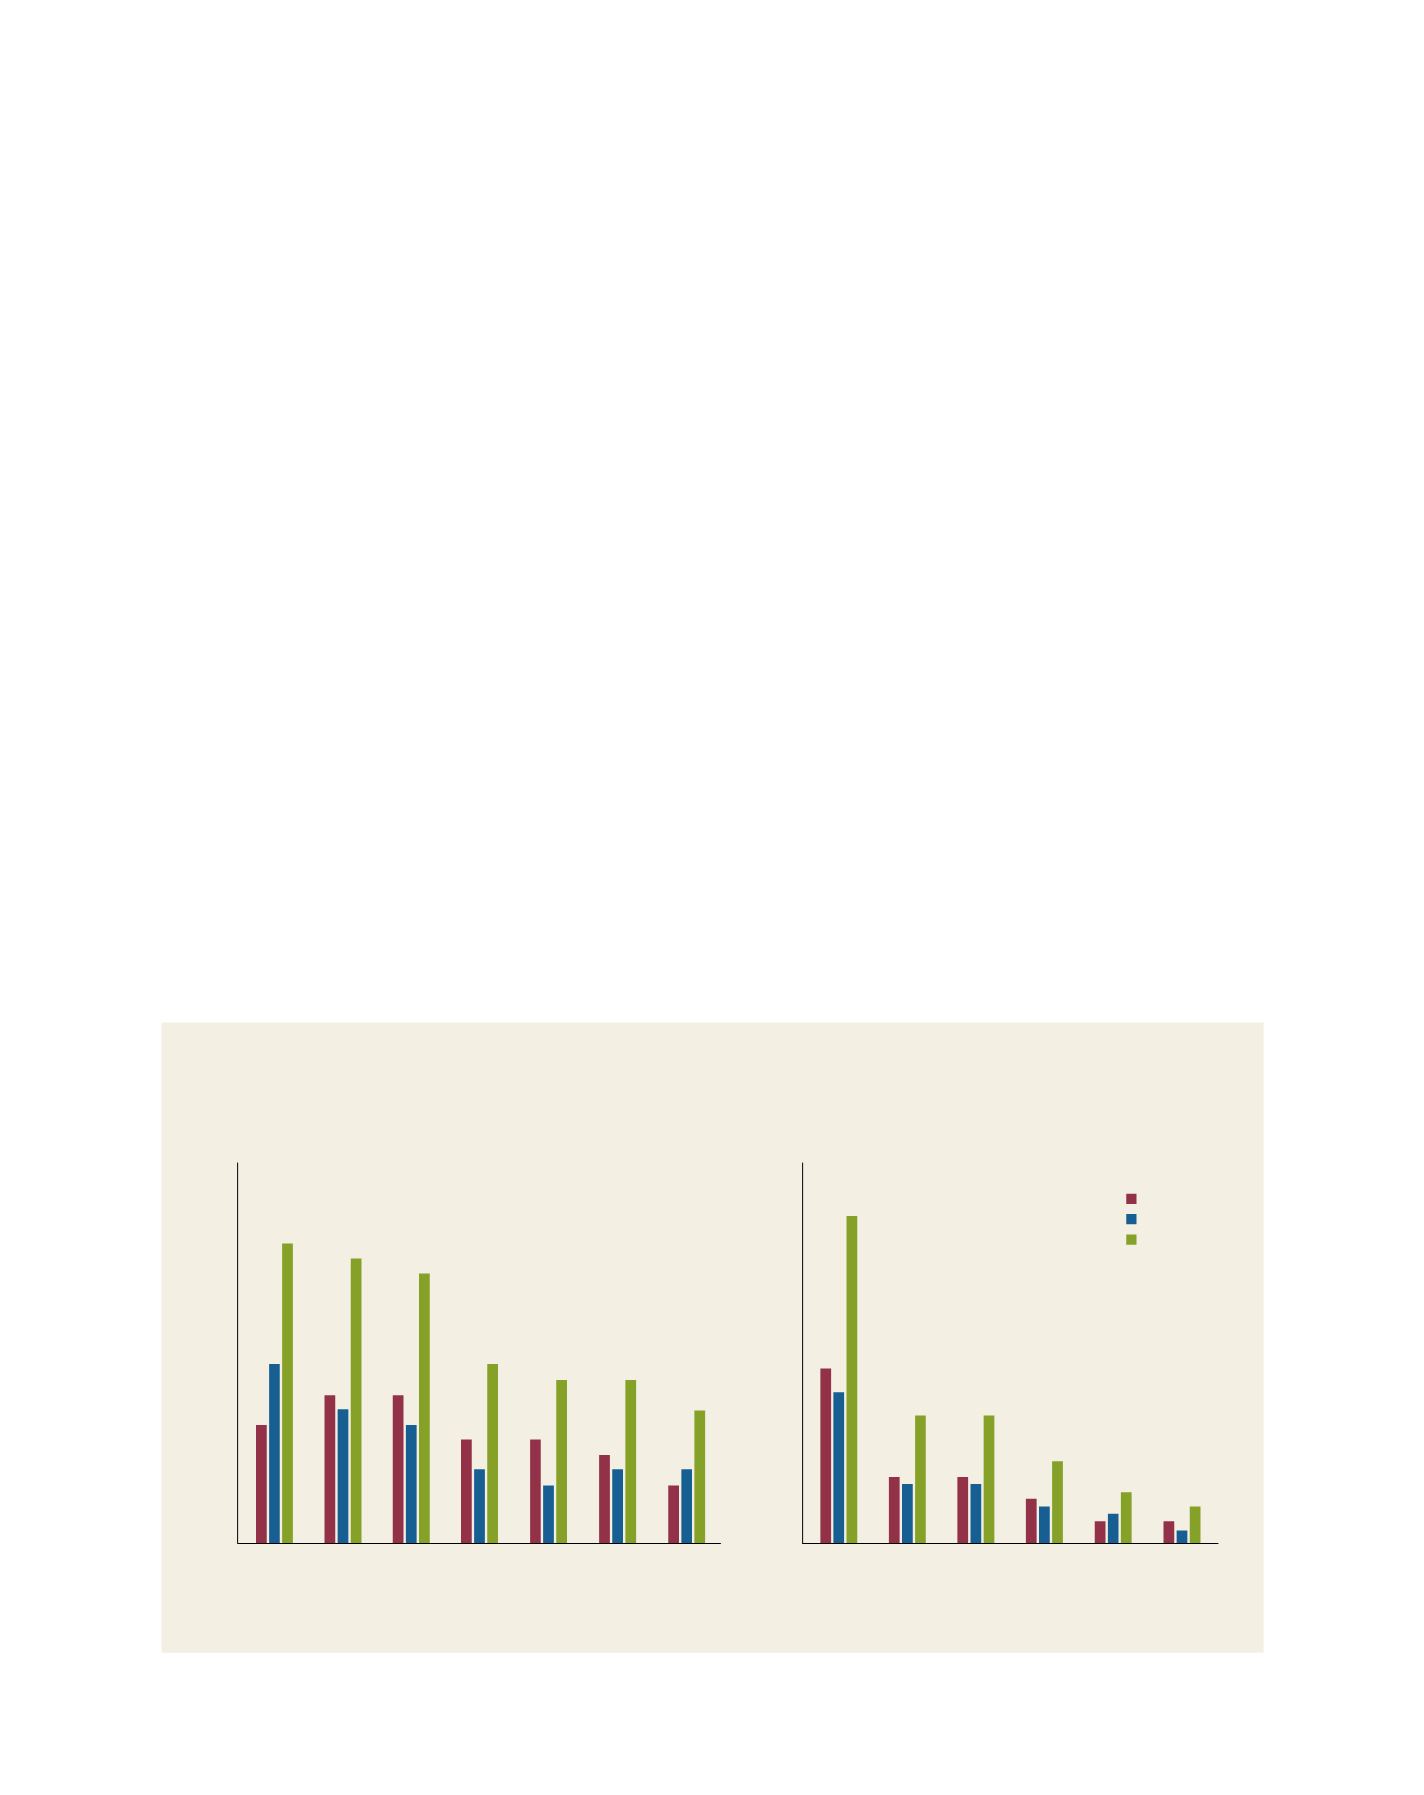
Priorities voted for by the residents of PPR Ampangan and PPR Jalan Sungai
Ampangan Apartment Complex
Projects
Projects
Per cent
Jalan Sungai Apartment Complex
Total
Men
Women
25
20
15
10
5
0
Recreational
park
Building
security
Recreational park won
8% women voted for it
12% men voted for it
Building maintenance won
23% women voted for it
20% men voted for it
Dangerous
junction
Space
for small
business
Activity
space
Security
of area
Security
of area
Parking
lots
Playground Education/
Awareness
programme
Building
maintenance
Cleanliness
Cleanliness
0
5
10
15
20
25
30
35
40
45
50
Per cent
A B
etter
W
orld