


 45 / 130

[
] 45
access
to
water
and
sanitation
for
all
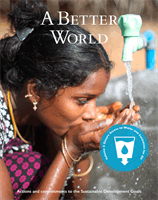
Among others, the graphic shows that 22% of the population is directly connected to (offsite) sewer systems, and 78% relies on onsite sanitation systems.
Overall, the excreta of only 20% of the population is managed safely and 80% of excreta is discharged into the environment untreated
21
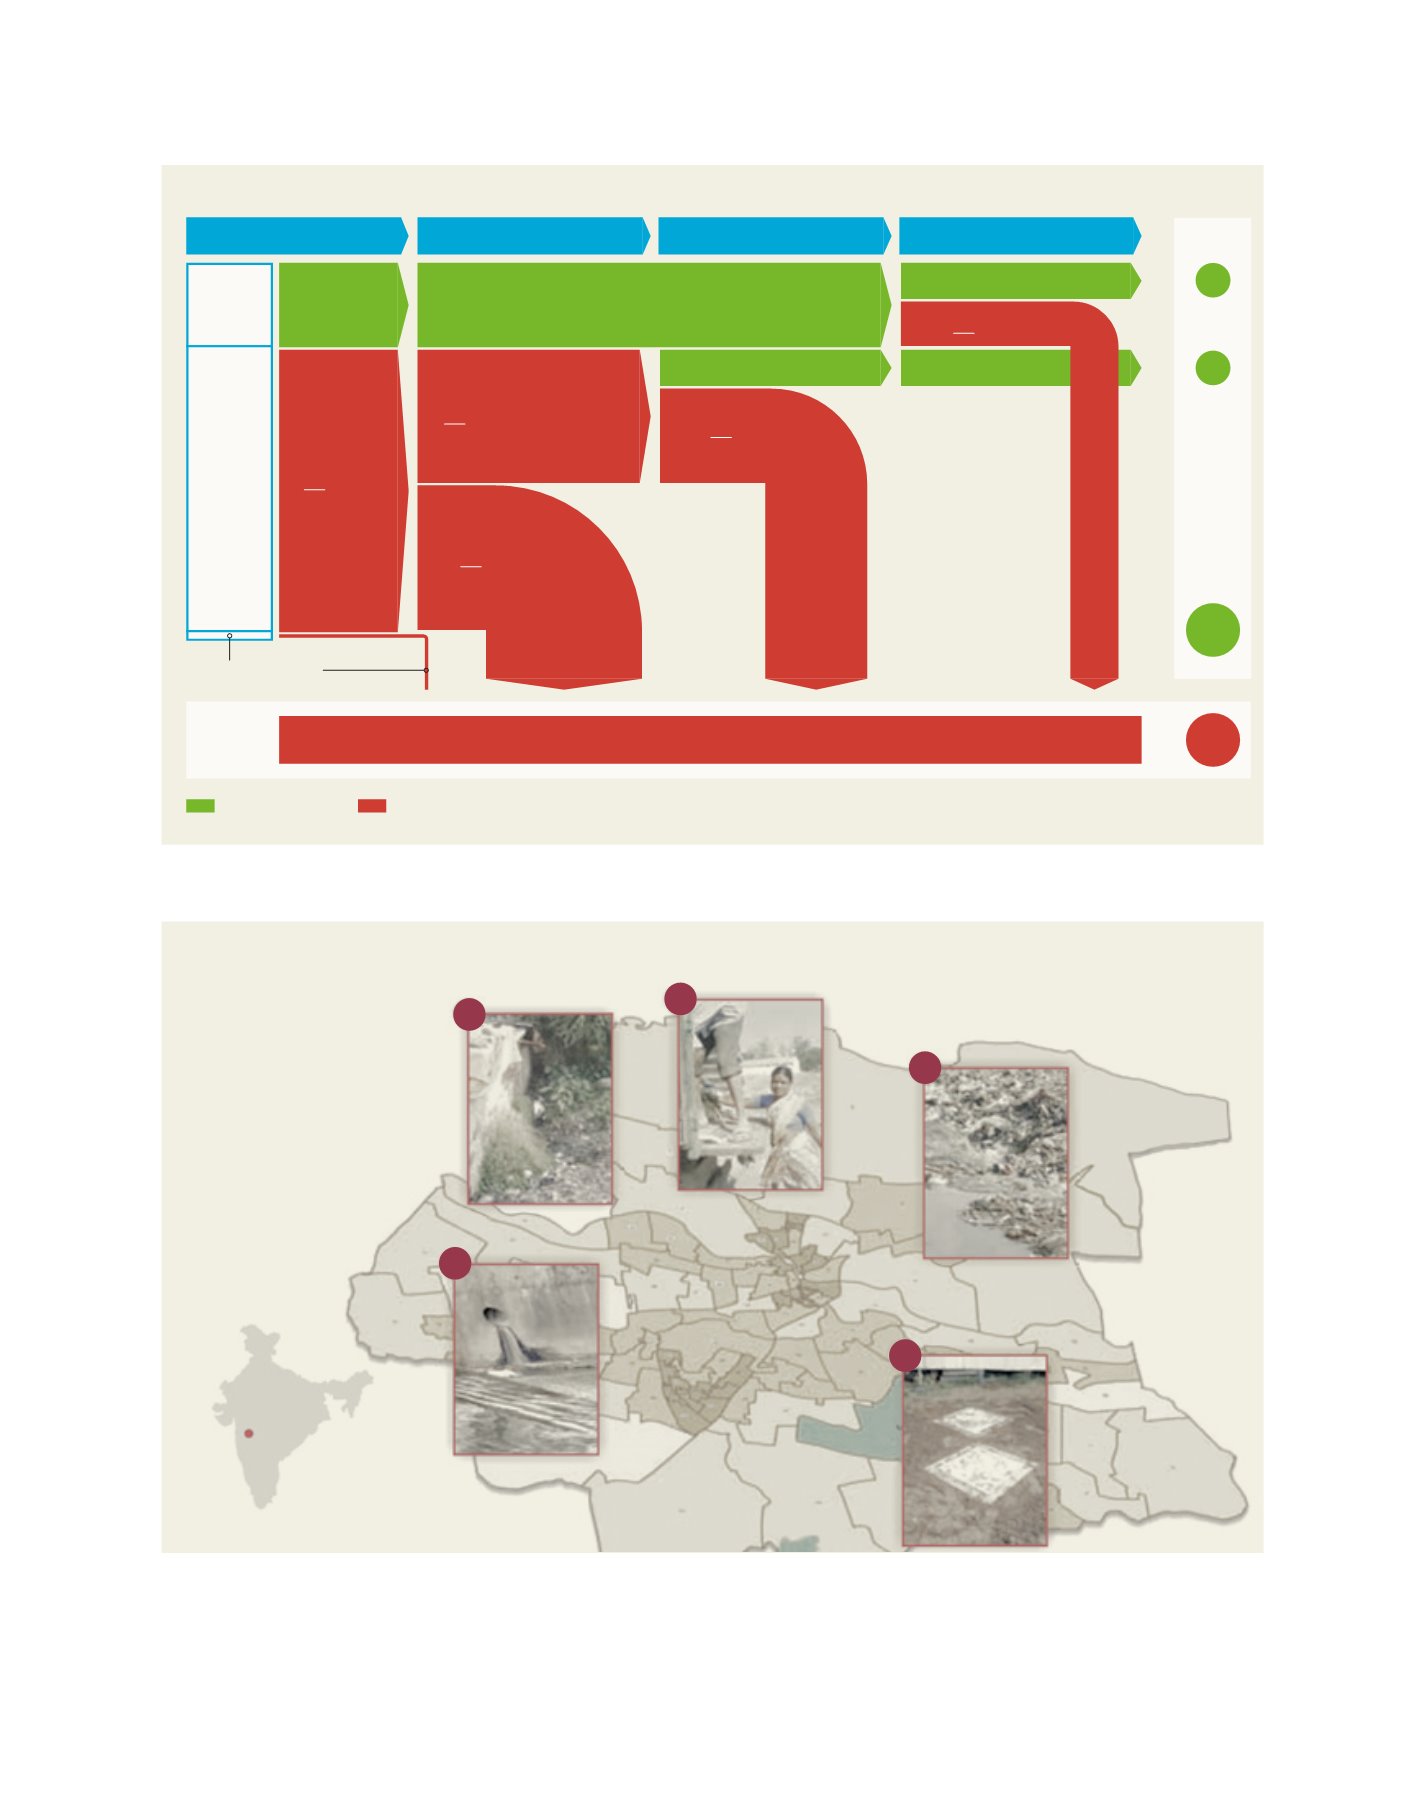
A city sanitation plan is preceded by an assessment of the sanitary conditions in the city. The plan then addresses the current concerns and plans for future
sanitary requirements through a participatory and holistic approach. The Nashik city sanitation plan was developed by the city with support from GIZ (Deutsche
Gesellschaft fuer Internationale Zusammenarbeit GmbH) with funds from the German Ministry for Economic Cooperation and Development. The city’s Waste to
Energy programme now works in the direction suggested by the plan
see 20,22
1 Open defecation / urination
2 Solid waste not segregated at source
3 Pollution at the Godavari River due
to open drains
4 Treated wastewater neither
used nor recycled
5 Possibility of ground water
pollution due to
septic tanks
Fig 6: Action areas identified by the City Sanitation Plan for Nashik, India
Source: GIZ Support to National Urban Sanitation Policy
5
4
3
2
1
Fig 5: SFD from Kochi, India
Safely managed Unsafely managed WW: Wastewater FS: Faecal sludge
Source: SFD Promotion Initiative
Emptying
Containment
Transport
Treatment
9%
11%
WW
treated
FS
treated
Offsite
sanitation
Onsite
sanitation
Open defecation 1%
Local area
Neighbourhood
City
80%
20%
WW contained
22%
WW contained – delivered to treatment 22%
FS delivered to treatment 11%
FS not contained
78%
FS not contained – emptied 37%
FS not contained 40%
FS not delivered to
treatment 26%
WW not treated 13%