


 41 / 130

[
] 41
access
to
water
and
sanitation
for
all
The power of iconography to reach SDG 6 and more
When Bill Gates met India’s prime minister Narendra Modi
in 2016, he used a graphic to begin discussions on the nature
of the sanitation crisis and where efforts should be focused
to overcome it. The graphic was an SFD depicting the sanita-
tion conditions of the Indian city of Trichy, and allowed for
a highly structured discussion by visually emphasising the
challenges and possible action fields for improving sanita-
tion management on a city-wide level. It also underlined the
importance of safe faecal sludge management in cities.
It became apparent that the power of SFD graphics lay in
the idea that they:
• Present both central and decentral systems in one image,
overcoming a breakdown in discourse on how to solve the
urban sanitation crisis that has existed for too long.
• Are inclusive, as they show the journey of the excreta of
all humans in a city.
• Use a systems approach to sanitation (see below), as they
follow the journey of excreta along the sanitation chain,
from containment, via transport to treatment and beyond.
• Establish a direct link to the viewer, especially if that
person lives in the city depicted in the graphic and is
curious as to the safety of excreta management.
• Establish a direct link to the viewer’s work, even if that
person does not work in the field of sanitation. SFDs are
helpful to a range of sectors in a city, for instance to the
health sector where the SFD shows to what extent misman-
aged or missing sanitation systems become a health concern;
to the environmental sector where it shows to what extent
unsafely managed excreta reach the environment; to reuse
concepts where it shows which sanitation system compo-
nents produce what kind of excreta flows (information
useful for biogas or fertiliser production, if safely managed).
• Can be linked to infrastructure considerations, and indicate
where to prioritise investment into urban sanitation.
The SFD as a prompt for expert discussion and action
The graphic itself does not solve, but discussion prompted by
the graphic among experts from various sectors has the poten-
tial to do so. When Prof. Barbara Evans, one of the first to
visualise excreta management in cities and towns, presented
an SFD graphic of Dhaka to the city’s mayor, he was alarmed.
It showed that, while open defecation was at only 1%, around
98% of the city’s excreta were unsafely managed.
4
This made
it immediately clear that further discussion with a broader
group of stakeholders was required to improve management.
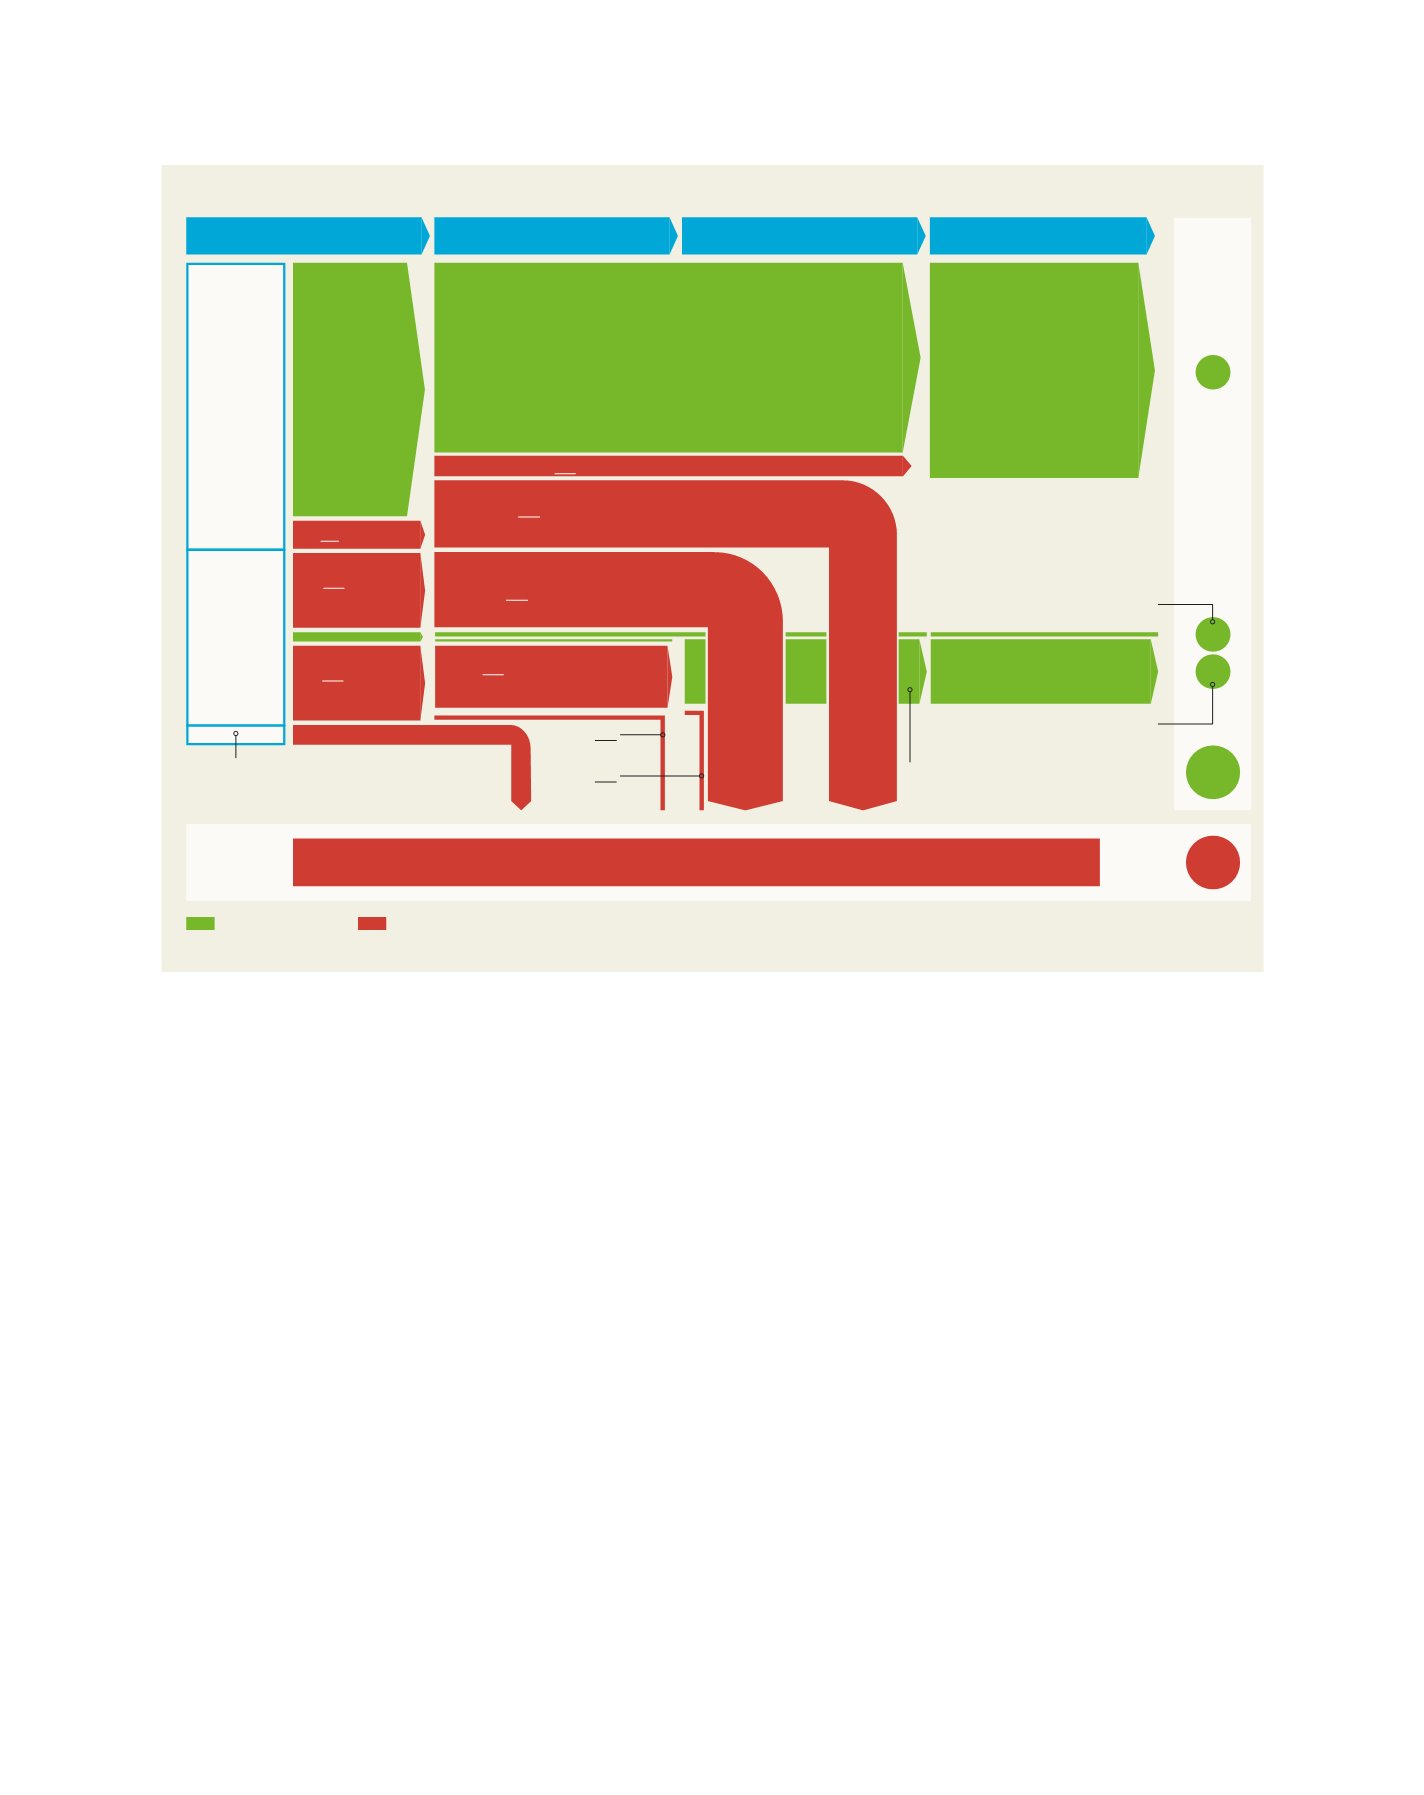
Fig 1: A typical Shit Flow Diagram
The graphic from the SFD report on Tiruchirappalli (Trichy), India,
3
shows that 60% of the population is dependent on offsite sanitation systems and 35% is
connected to a sewer line. Finally, 5% of the population practices open defecation. It can be concluded that the excreta of 60% of the population is managed safely
and 40% of excreta is discharged into the environment untreated. The potential of SFDs as a tool to communicate sanitation gaps is widely recognised in the sector
Offsite
sanitation
Onsite
sanitation
Local area
Neighbourhood
City
Safely managed Unsafely managed WW: Wastewater FS: Faecal sludge SN: Supernatant
WW contained
54%
WW contained delivered to treatment
40%
WW not contained 6%
WW not contained delivered to treatment 5%
SN not contained
16%
FS not contained
16%
FS not contained – emptied
15%
Emptying
Containment
Transport
Treatment
14%
40%
60%
1%
45%
Source: SFD Promotion Initiative
Open defecation
Open defecation 5%
FS not
delivered to
treatment 2%
FS not
contained 2%
FS contained not emptied
FS treated
SN not delivered to treatment 16%
FS delivered to treatment 14%
WW
treated
WW not delivered to treatment 15%