


 40 / 130

[
] 40
A B
et ter
W
or ld
The SuSanA platform and the Shit Flow Diagram –
tools to achieve more sustainable sanitation for all
Arne Panesar, Dirk Walther, Thomas Kauter-Eby, Susanne Bieker, Deutsche Gesellschaft fuer Internationale
Zusammenarbeit (GIZ) GmbH; Suresh Rohilla, Centre for Science and Environment (CSE); Regina Dube, Ministry of
Environment and Energy of the City of Hamburg; Kim Augustin, HamburgWasser; Roland Schertenleib, formerly Swiss
Federal Institute of Aquatic Science and Technology (EAWAG)
D
aniela Krahl of the German Federal Ministry for
Economic Development and Cooperation (BMZ) has
said that: “The water strategy of our Ministry is seen
as a model because it addresses the spirit of the SDGs in a
holistic manner, thus going beyond SDG 6. That is what we
need today and that is why I like the excreta flow diagram. It
brings people from different spheres together to understand a
challenge that they can only solve together. A platform – the
Sustainable Sanitation Alliance (SuSanA) – has been formed
to allow for discussion on sanitation at all levels, particularly
with an inter-sectoral outlook, and with the aim to find equi-
table and sustainable solutions. That is why the Ministry is
supporting cooperation in German development expertise on
this platform, and is proud to see its positive impact.”
Human excreta can pollute water and settlements, spread-
ing deadly pathogens and emitting methane that contributes
to global warming. They can also provide a safe fertiliser to
help build a world without hunger, and create energy for a
circular economy. Solving the sanitation crisis is therefore a
challenge and opportunity in need of cross-sectoral commu-
nication, and facilitating such communication requires a new
language and new communication tools.
The SuSanA is a platform built for developing and enabling
communication for this purpose.
1,2
One of the tools used to
inform stakeholders from a range of backgrounds on city-
wide sanitation conditions is known colloquially as the Shit
Flow Diagram (SFD), which often forms a crucial basis for
discussion among a wide range of urban agencies on future
steps towards better urban sanitation for all.
There are three key concepts that link sanitation to the
Sustainable Development Goals as a whole – the systems
approach to sanitation; viewing sanitation as part of a circu-
lar economy; and the use of SFDs. These crucial elements
are brought together on the SuSanA platform with the aim
of addressing the SDGs holistically.
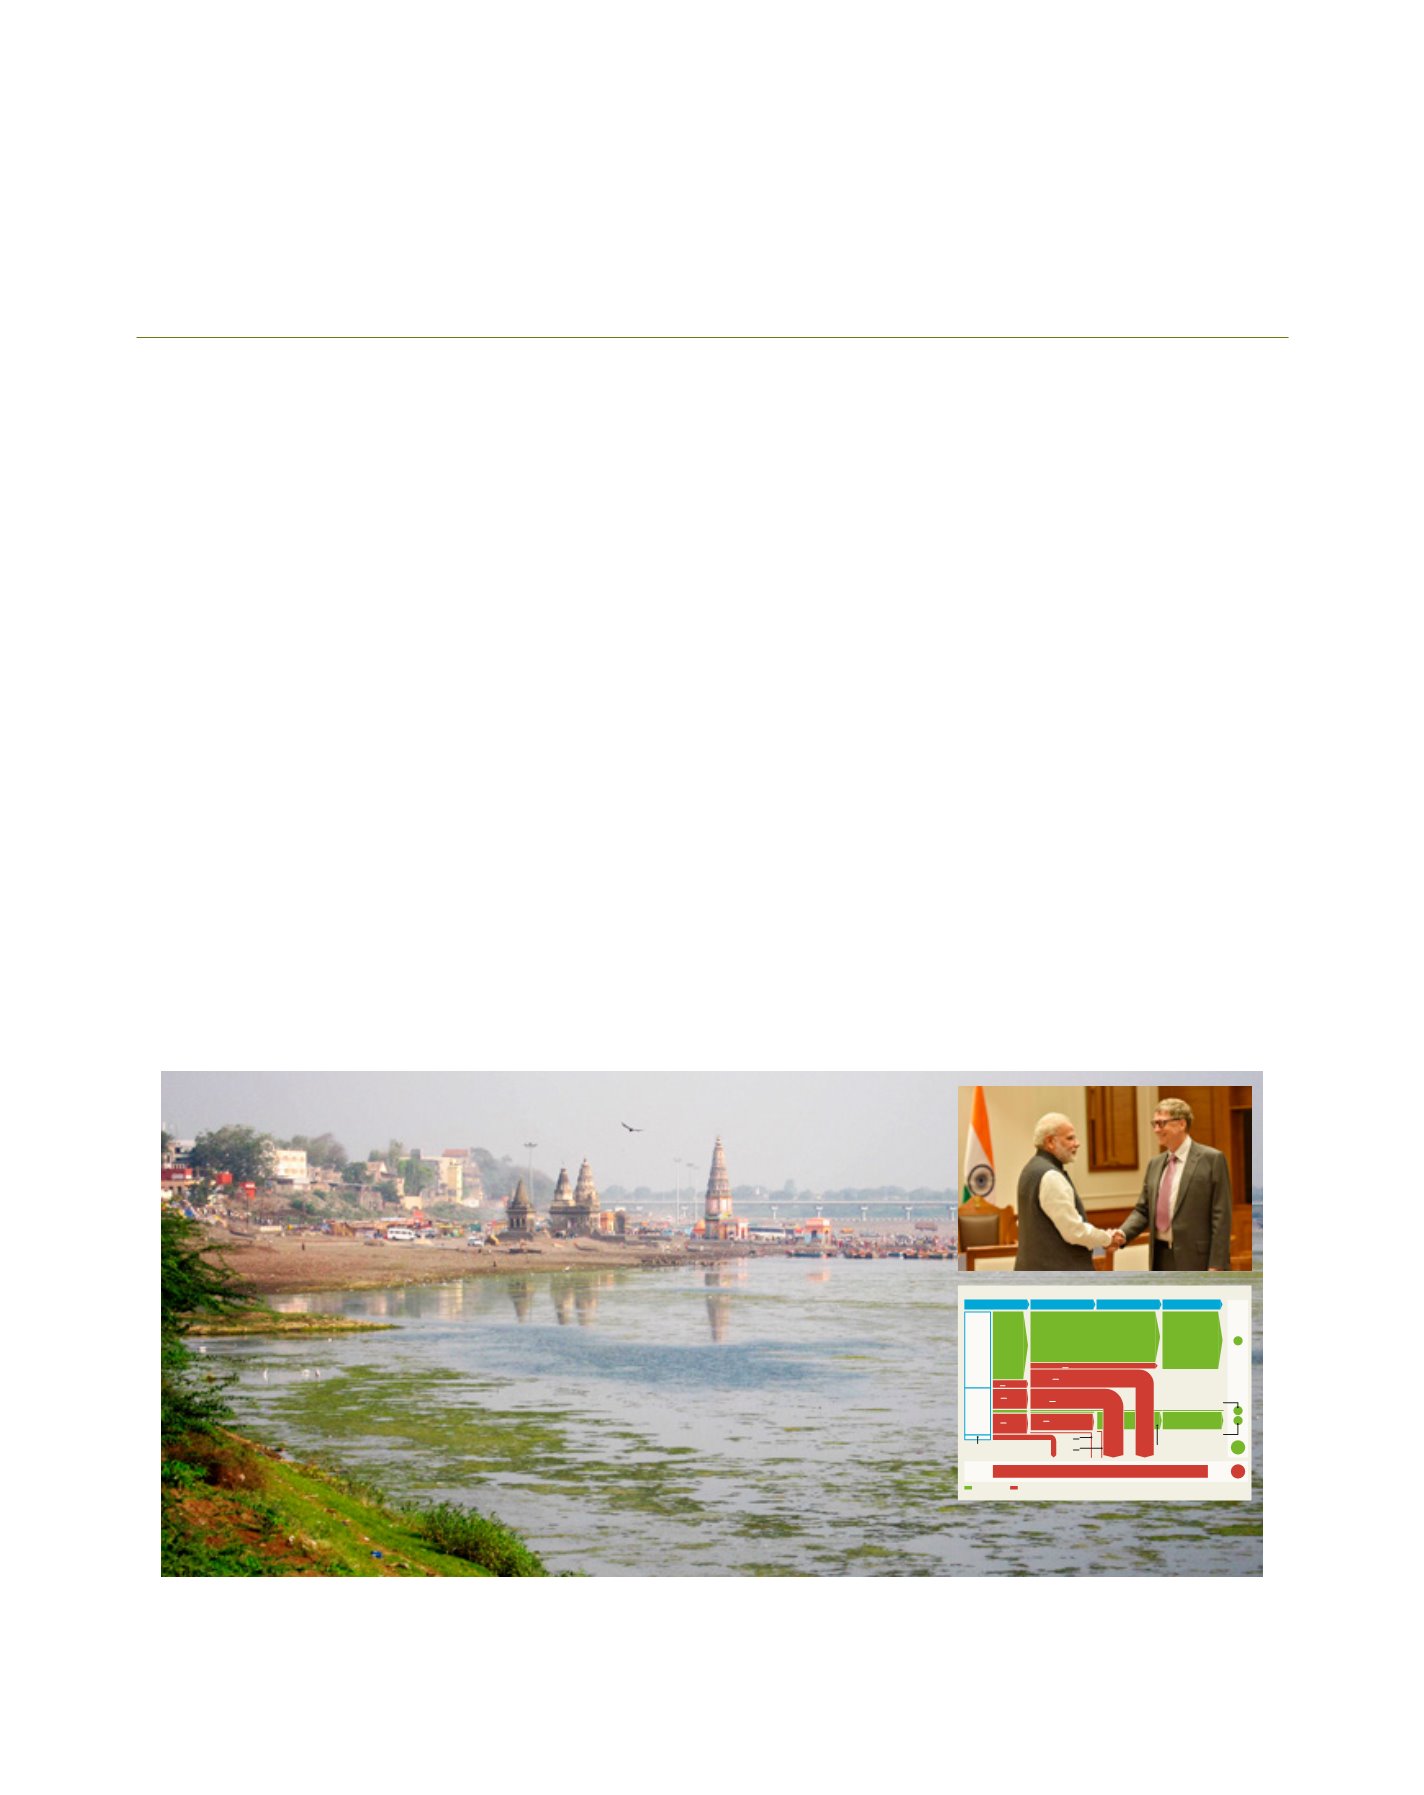
A Shit Flow Diagram (SFD) is an advocacy and decision support tool that summarises and presents in a concise report what happens to excreta in urban
areas. When Bill Gates met India’s prime minister, Narendra Modi in 2016, he used an SFD graphic to begin an exchange on the urban sanitation crisis and
where efforts might be focused to address it efficiently
Fig1:A typicalShitFlowDiagram
Offsite
sanitation
Onsite
sanitation
Localarea
Neighbourhood
City
Safelymanaged Unsafelymanaged WW:Wastewater FS: Faecal sludge SN:Supernatant
WW contained
54%
WW containeddelivered to treatment
40%
WWnotcontained6%
WWnotcontaineddelivered to treatment5%
SNnotcontained
16%
FSnotcontained
16%
FSnotcontained–emptied
15%
Emptying
Containment
Transport
Treatment
14%
40%
60%
1%
45%
Source:SFDPromotion Initiative
Opendefecation
Opendefecation5%
FSnot
delivered to
treatment2%
FSnot
contained2%
FS containednotemptied
FS treated
SNnotdelivered to treatment16%
FSdelivered to treatment14%
WW
treated
WWnotdelivered to treatment15%
Image: Arne Panesar
Image: Press Trust of India (PTI)