


 58 / 130

[
] 58
access
to
water
and
sanitation
for
all
to improve their water and sanitation infrastructure and are
able to repay these loans. A majority of WaterCredit borrow-
ers (55%) are living on under US$1.90 per day. Only less than
1% of very poor water and sanitation loan recipients were
delinquent over 30 days. Not only do these clients belong to
poor households, a key aspect is that over 90% of these loans
are borrowed by women. Table 1 shows the key character-
istics of loan portfolios across major countries where loans
were disbursed under the WaterCredit program.
Apart from direct benefits in terms of improved water
and sanitation facilities, household investments in access
to water and sanitation have shown to produce significant
returns, including socio-economic and health impacts. In
a recent evaluation in India, around 25% of WaterCredit
borrowers reported reduced illness and one in five reported
reduced medical expenses. Previous studies have shown that
reducing illness improves children’s school attendance and
lifetime earning potential. Access to improved water and
sanitation also reduces the incidence of chronic diarrhoea,
which correlates to improved cognitive function and reduced
risk of impaired growth. Research suggests that impaired
growth decreases the likelihood that children will lead
healthy, economically productive lives.
Access to improved on-site water and sanitation brings
dignity, safety, and privacy to the family, especially for
women, children, and the elderly. External evaluations of
WaterCredit interventions show that women with a toilet in
the home are safer and have more privacy than those who
must find isolated locations far from the home to defecate.
Around 39% of sanitation loan recipients reported increased
safety, after acquiring a toilet at home
4
.
A large percentage of households with improved access
to water and sanitation have experienced increased house-
hold income. Before taking a loan, only 53% of WaterCredit
borrowers in India made at least US$47 per month; after the
loan, this proportion nearly doubled to 97%, suggesting that
the investment in water and/or sanitation may have contrib-
uted to households’ abilities to generate income. According to
the WaterCredit impact evaluations, nearly 25% of borrow-
ers attributed increased income to extra time for women,
regained from minimised water collection times. Similarly,
one in five attributed increased income as a result of increase
in overall productivity due to fewer negative health impacts
from water or sanitation
4
.
Lessons and challenges
A joint World Bank and Water.org study found that microfi-
nance is a key tool in breaking down the barriers that prevent
those at the bottom of the economic pyramid from accessing
improved water and sanitation
5
. In reaching more than 7.1
million people through WaterCredit, Water.org has grasped
a better understanding of the factors required for increased
sustainability and scalability of WaterCredit operations and
has made and proven the case for WSS financing. A recent
evaluation of a WaterCredit intervention in India showed that
trained MFI staff and self-help groups were valuable change
agents in their communities, helping to drive behaviour
change and providing necessary product information
5
. The
intervention’s success in the notoriously challenging state of
Odisha also demonstrates that there can be a healthy demand
for WSS microfinance, even in areas that are deemed to have
less favourable microfinance environments
6
.
To address sustainability and scalability, a recent case
study
7
outlined the major enablers and constraints identified
in WaterCredit partners in India. Among the factors, access
to loan capital was identified as a major constraint by half of
the India WaterCredit partners in the study, largely due to
reluctance among commercial banks to finance WSS port-
folios. However, the inclusion of WSS in the Reserve Bank
of India’s Priority Sector Lending in April 2015 has enabled
$500
$450
$400
$350
$300
$250
$200
$150
$100
$50
$0
$18.00
$16.00
$14.00
$12.00
$10.00
$8.00
$6.00
$4.00
$2.00
$0.00
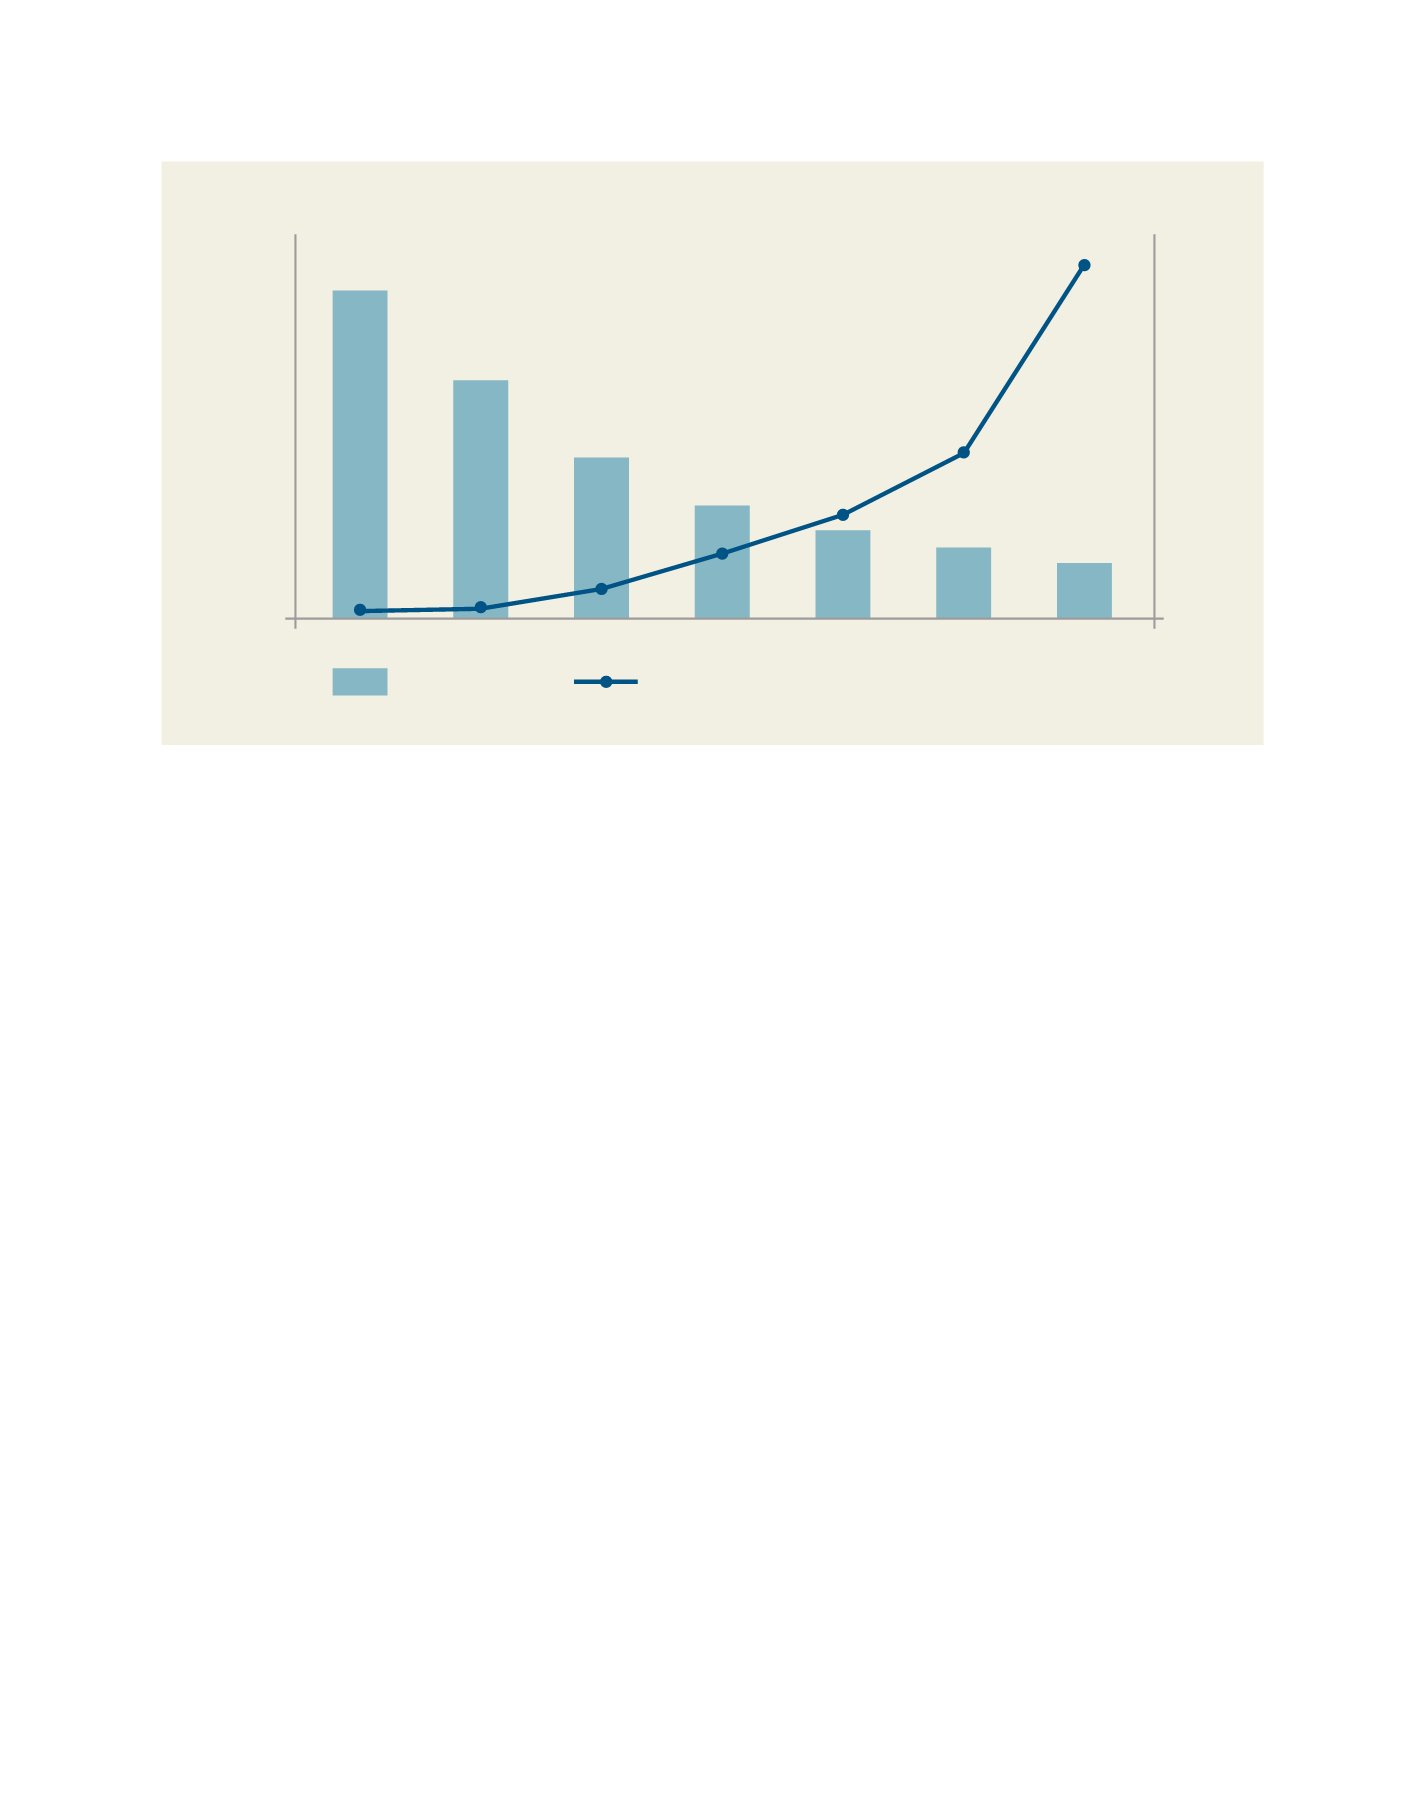
FY04–11
Loan amount disbursed (Millions)
Loan amount disbursed
Cost per person
$15.48
$11.15
$7.66
$5.37
$4.17
$463,463,229
$220,491,990
$139,184,598
$87,283,759
$40,475,340
$13,054,414
$6,306,107
$3.45
$2.72
FY11
FY13
FY14
FY15
FY16
FY17
Fig 2: Cumulative cost per person under the WaterCredit program, as of August 2017
Source: Water.org