


 69 / 130

[
] 69
A B
et ter
W
or ld
A
nnual precipitation in the Republic of Korea is
approximately 1,300mm, 1.6 times the world’s
average of 813mm. The country’s annual total
water resources amount to 132.3bn m³ but, due to a high
population density, the average annual water resource
amount per capita is 2,546m³ – one sixth of the world’s
average of 15,044m³. Since 65% of Korea’s topography
comprises steep-sided valleys, river gradients are also
steep. Therefore, during the rainy season from June to
September in which 68% of annual precipitation occurs,
flash floods and increased water flow make water manage-
ment difficult. Droughts are also increasing in frequency
and intensity since precipitation is scarce for most of the
year. Water management policy has therefore focused on
securing and storing flood waters in dams and reservoirs
during the rainy season.
The water supply penetration rate in Korea is more than 98%,
with most people using water services. However, significant
challenges are created by water loss
1
caused by the deterio-
ration of water pipes and the gap between metropolitan and
provincial pipeline networks. Korea is no exception to global
climate and weather changes, and some recent years have
seen unprecedented droughts, with various regions facing
serious water problems.
Korea’s waterworks business operates both with a multi-
regional water supply, delivered on a wholesale basis by
K-water from national rivers and dams, and a local supply
which is operated on a retail basis by local governments,
either using their own water source or a multi-regional water
supply system.
One of the most important tasks for Korean water supply
services is now to minimize the amount of leakage and
to supply consistently safe water to users. Smart Water
Management (SWM) technology is therefore essential as it
allows operators to use real time information to cope with
such challenges. SWM combines various technologies
such as information and communication (ICT) systems,
Improvement of water use efficiency through
Smart Water Management
Seong Han Kim, Vice President and Chief Research Officer, K-water; Nam Soo Lee, General Manager, Water Policy
Research Center, K-water; Ah Leum Lee, Researcher, Water Policy Research Center, K-water
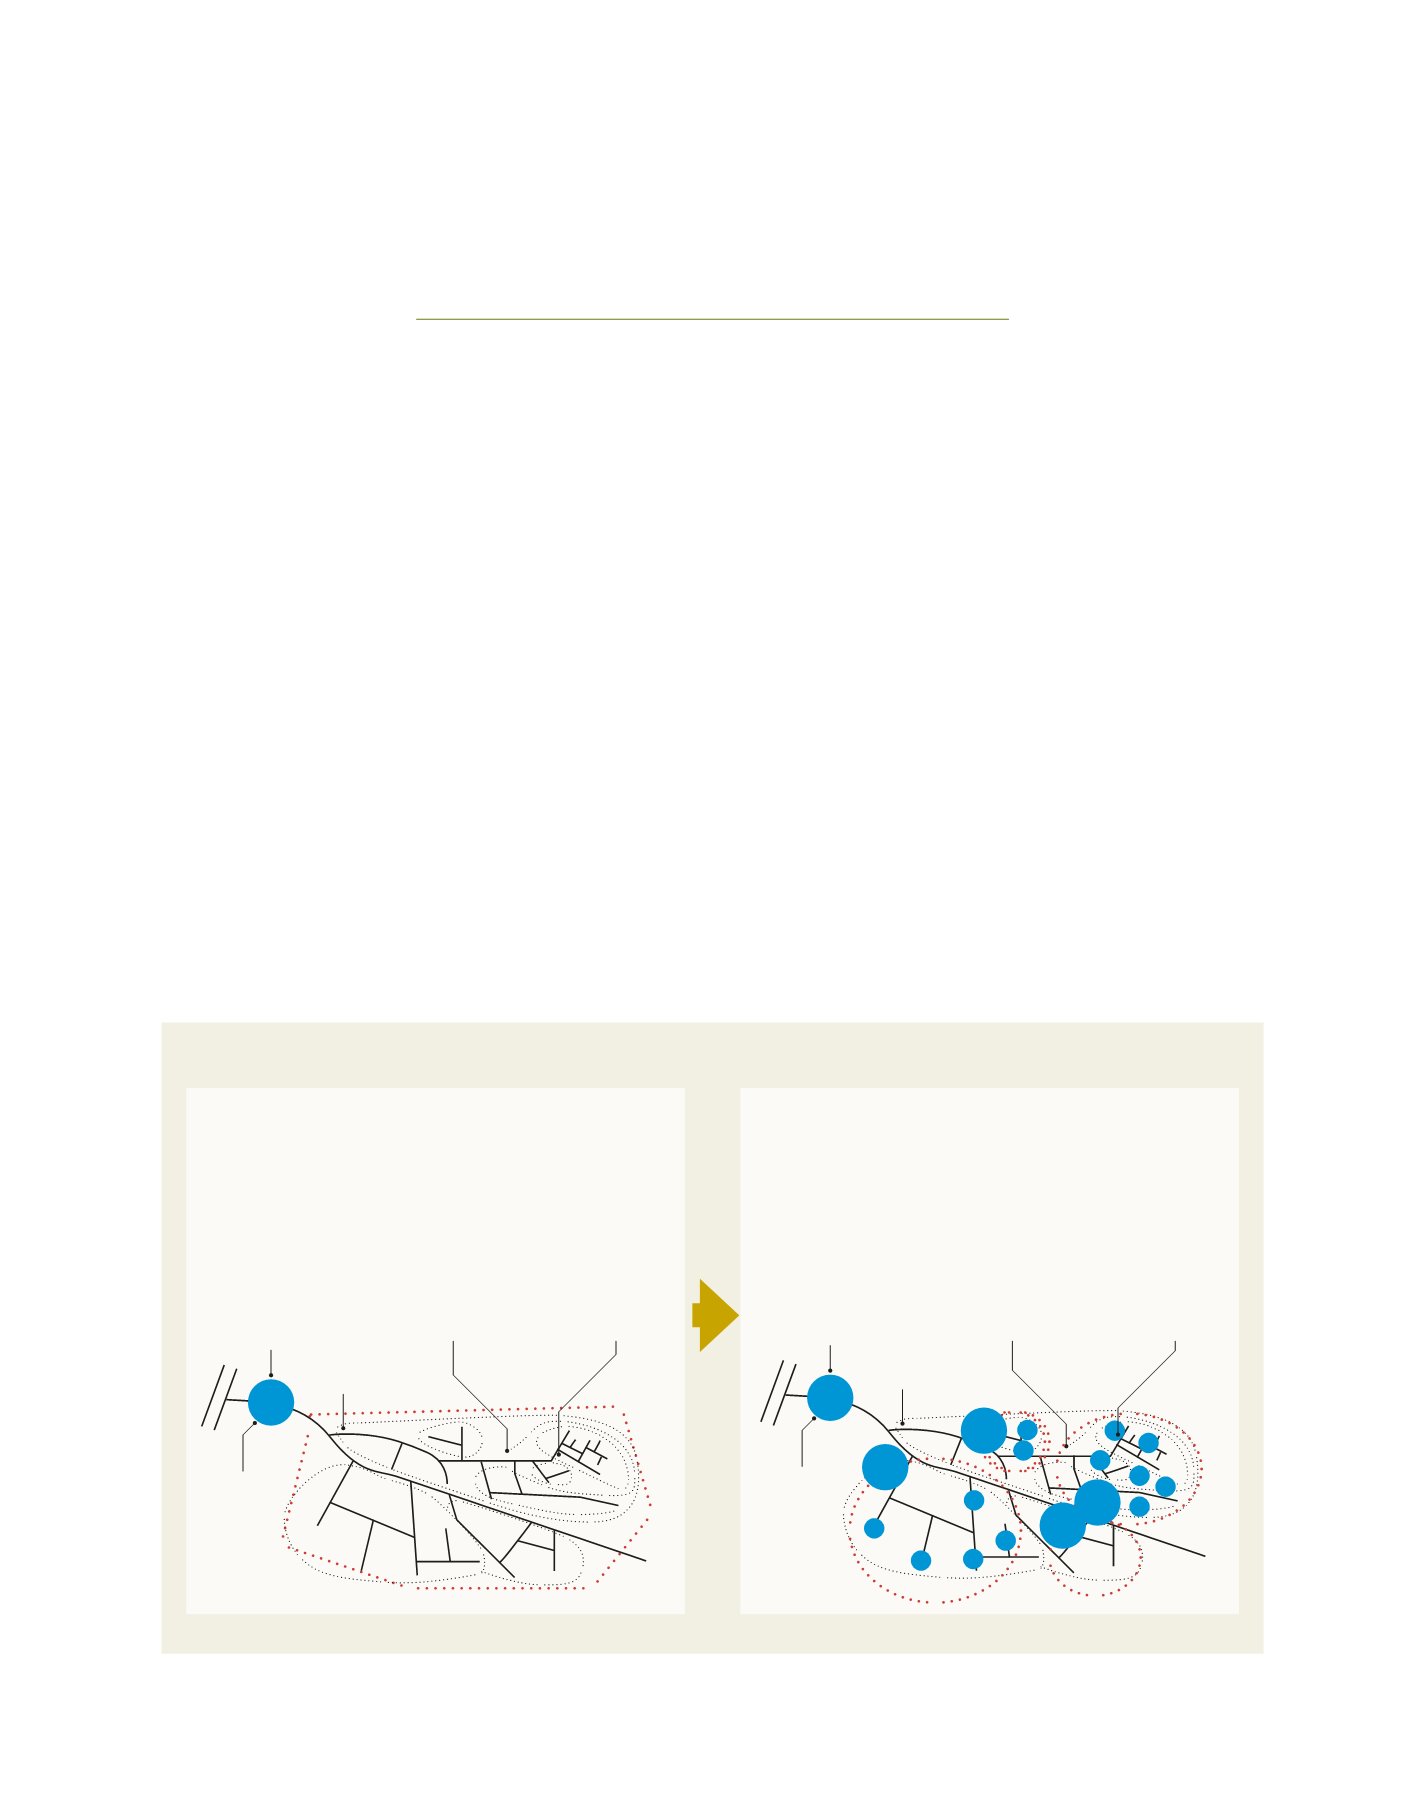
Intake and
treatment works
Bulk meter into
supply zone
District meter
measures flow into
districts e.g. 1,000–
3,000 properties
Sub district meter
measures flow into
smaller area e.g.
1,000 properties
Source meter
measures total
output
River
Mains
Mains
M
M
MM
Intake and
treatment works
Bulk meter into
supply zone
District meter
measures flow into
districts e.g. 1,000–
3,000 properties
Sub district meter
measures flow into
smaller area e.g.
1,000 properties
Source meter
measures total
output
River
Mains
Mains
M
M
M
M M
M
M
M
M
M
M
M
M
M
M
MM
Improvements through smart meter technology
Source : K-water Internal Data
• Flow rate and pressure management by 1 DMA
(1 Flow™ plus general meter for customer)
• 500–1500 customers/DMA
• Monitoring only 1 MNF
• NRW management monthly
• 1 DMA + 3–5 SDMA
(1 Flow™ +3–5 SM + SM for every customer)
• About 300 customers/SDMA
• Hourly base monitoring by SDMA
• Daily base NRW management
M
M
M
M