


 70 / 130

[
] 70
access
to
water
and
sanitation
for
all
Supervisory Control And Data Acquisition
3
(SCADA)
systems, smart meters and other devices to ensure stabil-
ity and efficiency throughout the network. SWM specifies
technologies and creates standards for the overall water
circulation system. Examples of application include Smart
Water Grid (SWG)
4
, Smart Water City (SWC)
5
, Integrated
Water Quality Forecasting System (SUIRAN)
6
, and Integrated
Water Management System (K-HIT)
7
.
A smart meter enables the transmission of information
concerning consumer tap water usage measured by time. The
use of digital meters and IoT technology as an alternative
to traditional analog meters allows operators to read meters
remotely as well as manage the water usage rate in real time.
The smart meter monitoring program analyses usage, abnor-
mal flow, and indoor leakage from the metering information
and provides usage and tariff information to customers
through the Internet and a mobile app. Previously, flow and
water pressure were managed in one District Metered Area
(DMA), but with the application of smart meters, the DMA is
divided into three to five SDMAs (Sub-District Metered Area).
The management of the daily water flow rate enables quicker
responses than before.
Smart metering makes it possible to quickly identify
leakage locations – immediate detection can reduce leakage
from burst pipes and reduce non-revenue water (NRW) –
to quickly correct inaccurate or damaged meters, to reduce
supply costs, to improve asset management efficiency, and
ultimately to enhance customer satisfaction.
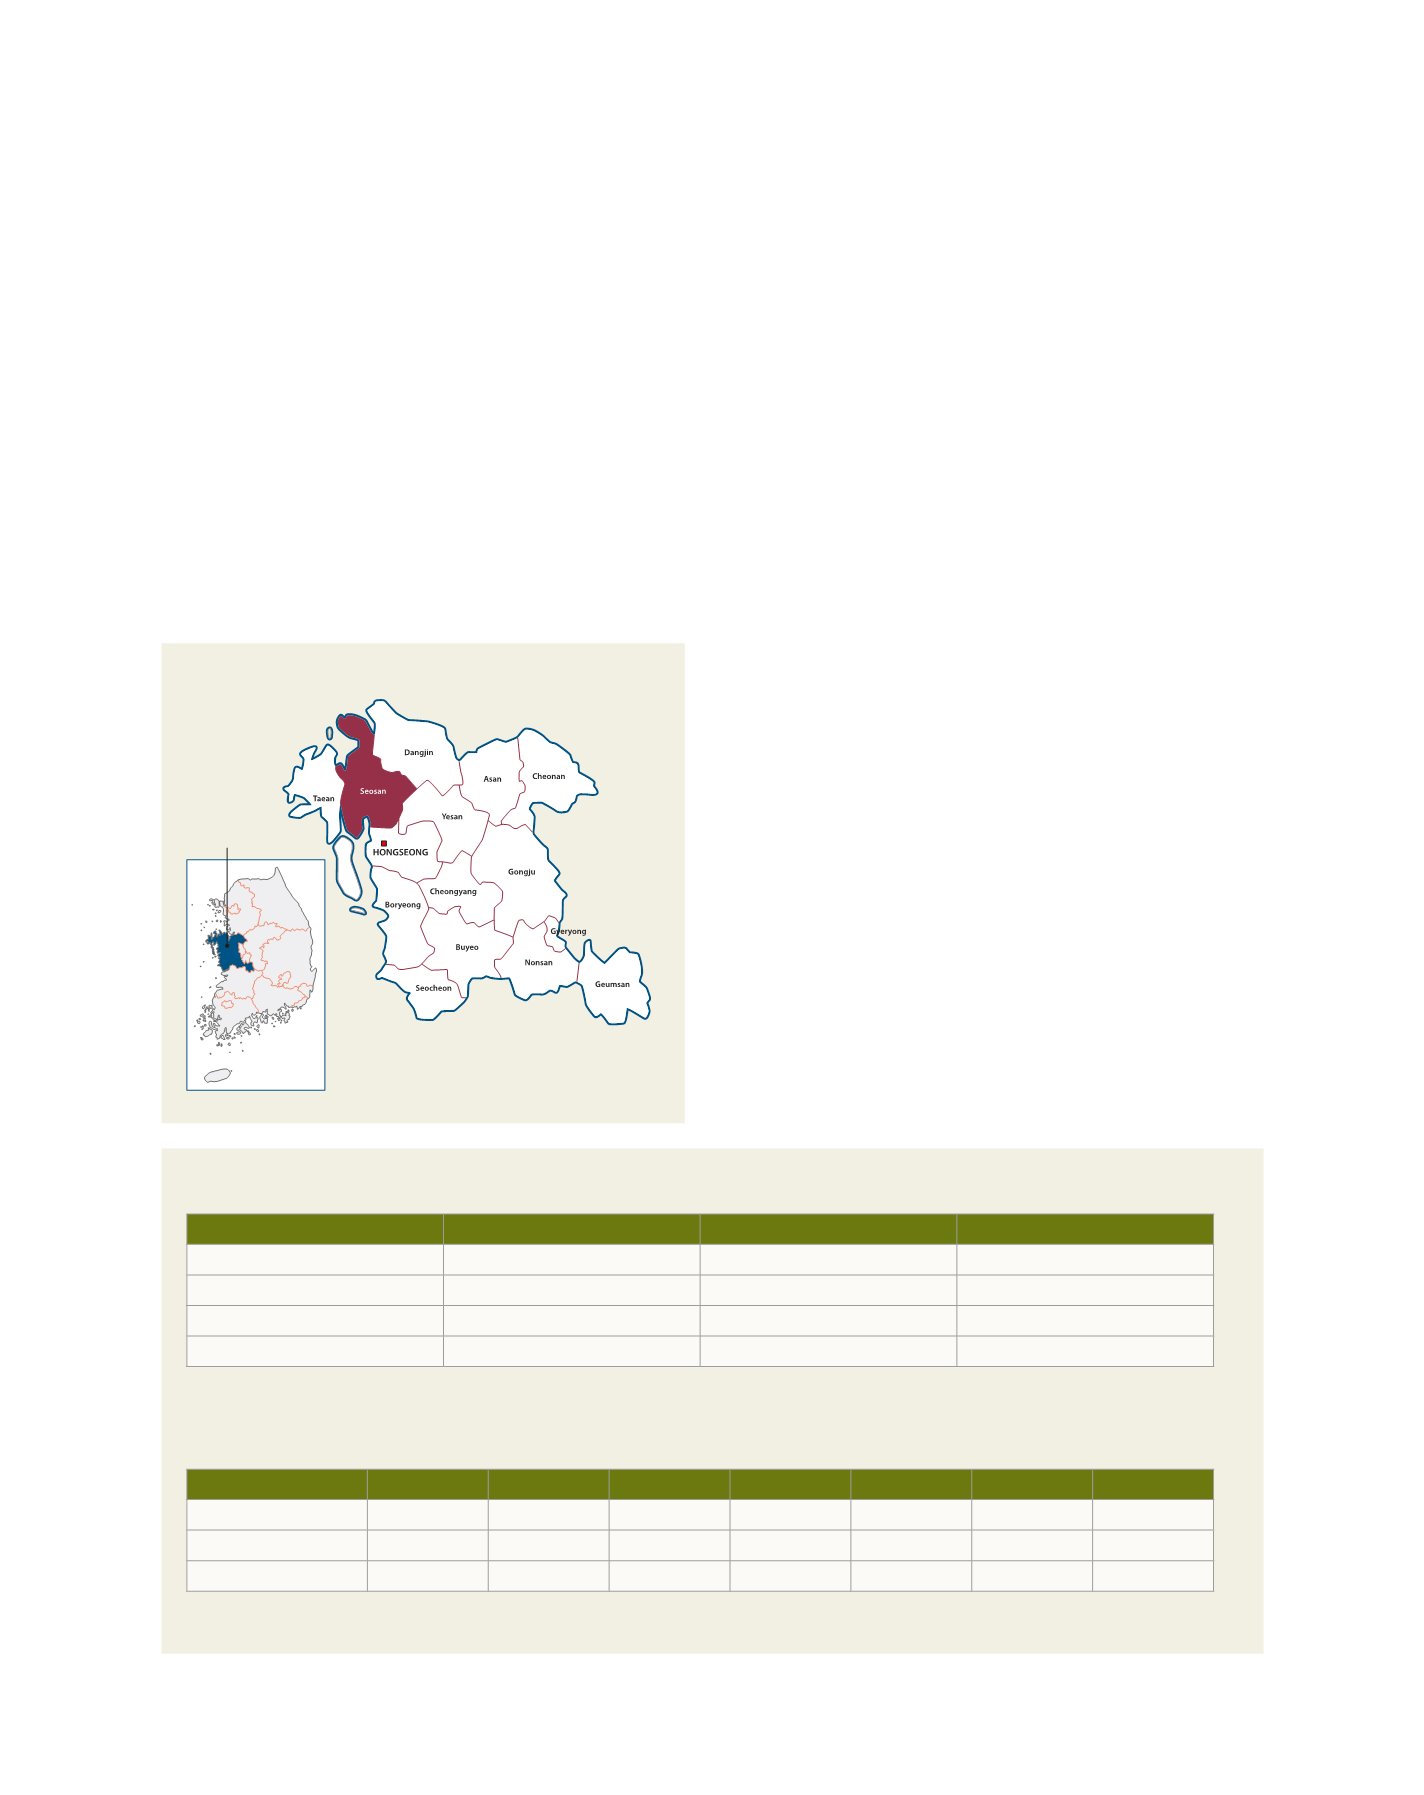
Case study – Seosan
In Seosan City, Korea, the Boryeong Dam is supplied by
80,700m
3
of water per day, sufficient for a population of
157,000. The water penetration rate is 91% and the NRW
is 16.6%. One area of the city, Cha-ri, was operated by two
DMAs and it was difficult to identify and cope with water loss
due to the relatively wide supply area. Efforts to reduce loss
were nevertheless essential because of drought.
In general, Seosan City has a relatively low NRW, whereas
that of Cha-ri was, in 2015, the city’s highest at 32%.
Improvements were made by installing smart metering, and
nine SDMA systems were built within the existing two DMAs.
In addition, NRW analysis, which had been conducted on
a monthly basis, was converted to a daily analysis system.
Finally, water flow monitoring was expanded from three
branches to twelve.
After installing smart metering, intensive leak detection
was carried out on vulnerable sections, reducing flow meter
errors. As a result of comparing the DMA flow rate and the
total flow rate of the water supply area in Cha-ri, a differ-
ence of 430m³ per day was found, inflow meter failures were
detected and flow meters were substituted.
After analysing the patterns of both seasonal and hourly
customer usage through smart metering, water pressure
management is now conducted hourly. Automatic control of
the decompression valve through SCADA facilitates adjust-
ment according to usage, depending on seasons and holidays.
Region
NRW (%)
Region
NRW (%)
National average
15.7%
Chung Cheong Nam Do
20.1%
Seoul
4.9%
Jeolla Nam Do
31.5%
Busan
8.3%
Jeolla Buk Do
31.5%
Daegu
8.8%
Gyeong Sang Buk Do
31.0%
Non-revenue water (NRW)
2
by region
NRW comparison, 2015 and 2016, Cha-ri water supply area, Seosan
Source : Water Supply Statistics 2015, Ministry of Environment(2016)
NRW (%)
March
April
May
June
July
August
September
2015
40.8%
36.5%
37.8%
28.8%
34.4%
26.2%
28.5%
2016
37.5%
26.6%
30.6%
26.8%
29.6%
11.6%
9.8%
Variation Rate
i
3.3%
i
9.9%
i
7.2%
i
1.9%
i
4.8%
i
14.6%
i
18.7%
Source : K-water Internal Data
Seosan, Chung Cheong Nam Do
Republic of Korea
Chung Cheong
Nam Do