
[
] 93
A B
et ter
W
or ld
Domestic water supply and sanitation in Libya
Omar Salem, General Water Authority, Libya
L
ibya is an arid country in north-central Africa with
a surface area in excess of 1.75 million km
2
and a
Mediterranean coastline of around 1,800km. More
than 90% of the country forms part of the Sahara desert,
with only the eastern and western coastal strips receiving
measurable precipitation, ranging from an average of 150 to
over 500mm annually. The country is among the most water-
scarce in the world, with renewable water resources of less
than 600 million m
3
/year and a per capita share of 100m
3
that will be reduced to less than 75m
3
by the year 2030.
Controlled surface water resources are in the order of 60
million m
3
and contribute only a small fraction of the total
water use, currently estimated at 5.6 billion m
3
/year, while
groundwater accounts for 97% and the remaining 1.5%
comes from desalination and wastewater treatment.
During the last six decades, the population has increased
from 1.09m in 1954 to 5.66m in 2006, an average annual
growth rate of 3.2 % for the period. The present population
is estimated at 6.4m and could exceed 8m by the year 2030.
The average population density is around 3.6 inhabitants/
km
2
and over 400 inhabitants/km
2
in the coastal strip.
Economic conditions in Libya have improved steadily since
the discovery of oil and gas reserves in the late 1950s, which
led to the rapid expansion of irrigated agriculture, urbaniza-
tion and industrial activities. Signs of water shortage began
to emerge in the early 1970s with a decline in water level and
a deterioration in the quality of water in the shallow fresh-
water aquifers due to seawater intrusion around major urban
agglomerations and areas of intensive irrigation.
The volume of water potentially available for use is in the
order of 3,820 million m
3
, of which 170 million m
3
is surface
water, 650 million m
3
is annual recharge to groundwater
aquifers and 3,000 million m
3
is an acceptable depletion rate
of the non-renewable aquifers. Accordingly, the estimated
deficit in the water balance has grown from 65 million m
3
in 1995 to 1,308 million m
3
in 2005, mostly in the Gefara
plain. Hydrogeological studies and surveys have confirmed
that Libya is increasingly depleting its precious groundwa-
ter resources, most of which are presently non-renewable. In
2006, only 13% of the groundwater used was renewable and
the front of seawater intrusion was advancing hundreds of
meters every year, threatening the traditional supply sources
of potable water. Elsewhere, water quality deterioration and
signs of pollution were emerging concurrently with aquifer
overexploitation, jeopardizing the continuity of the water
supply and entailing heavy financial burdens.
In Libya, 80% of the population lives in urban centres
varying in size from 5,000 to over 1m inhabitants, relying
mostly on the municipal water supply. In rural areas, people
depend on private wells, rainwater collection, springs or truck-
mounted water. Domestic water accounts for 12% of the total
water in use and despite severe scarcity, the average per capita
consumption is among the highest in the region at 450 l/c/d.
In 2010, desalination accounted for 13% of the total
domestic use, dropping to 12.4% in 2012. In 2015, the total
municipal water supply reached 601 million m
3
with only
7.85% from desalination. Projected demand will be close to
1 billion m
3
/year by 2030, compared to only 420 million m
3
in 1990, reflecting an annual growth rate of 2.2% which is
slightly higher than the projected population growth rate.
The urban population increased from 27.3% in 1960 to 60.7
in 1980 and 79.9 % in 2017 and may exceed 82% by 2030,
which is much higher than the average proportion in Africa
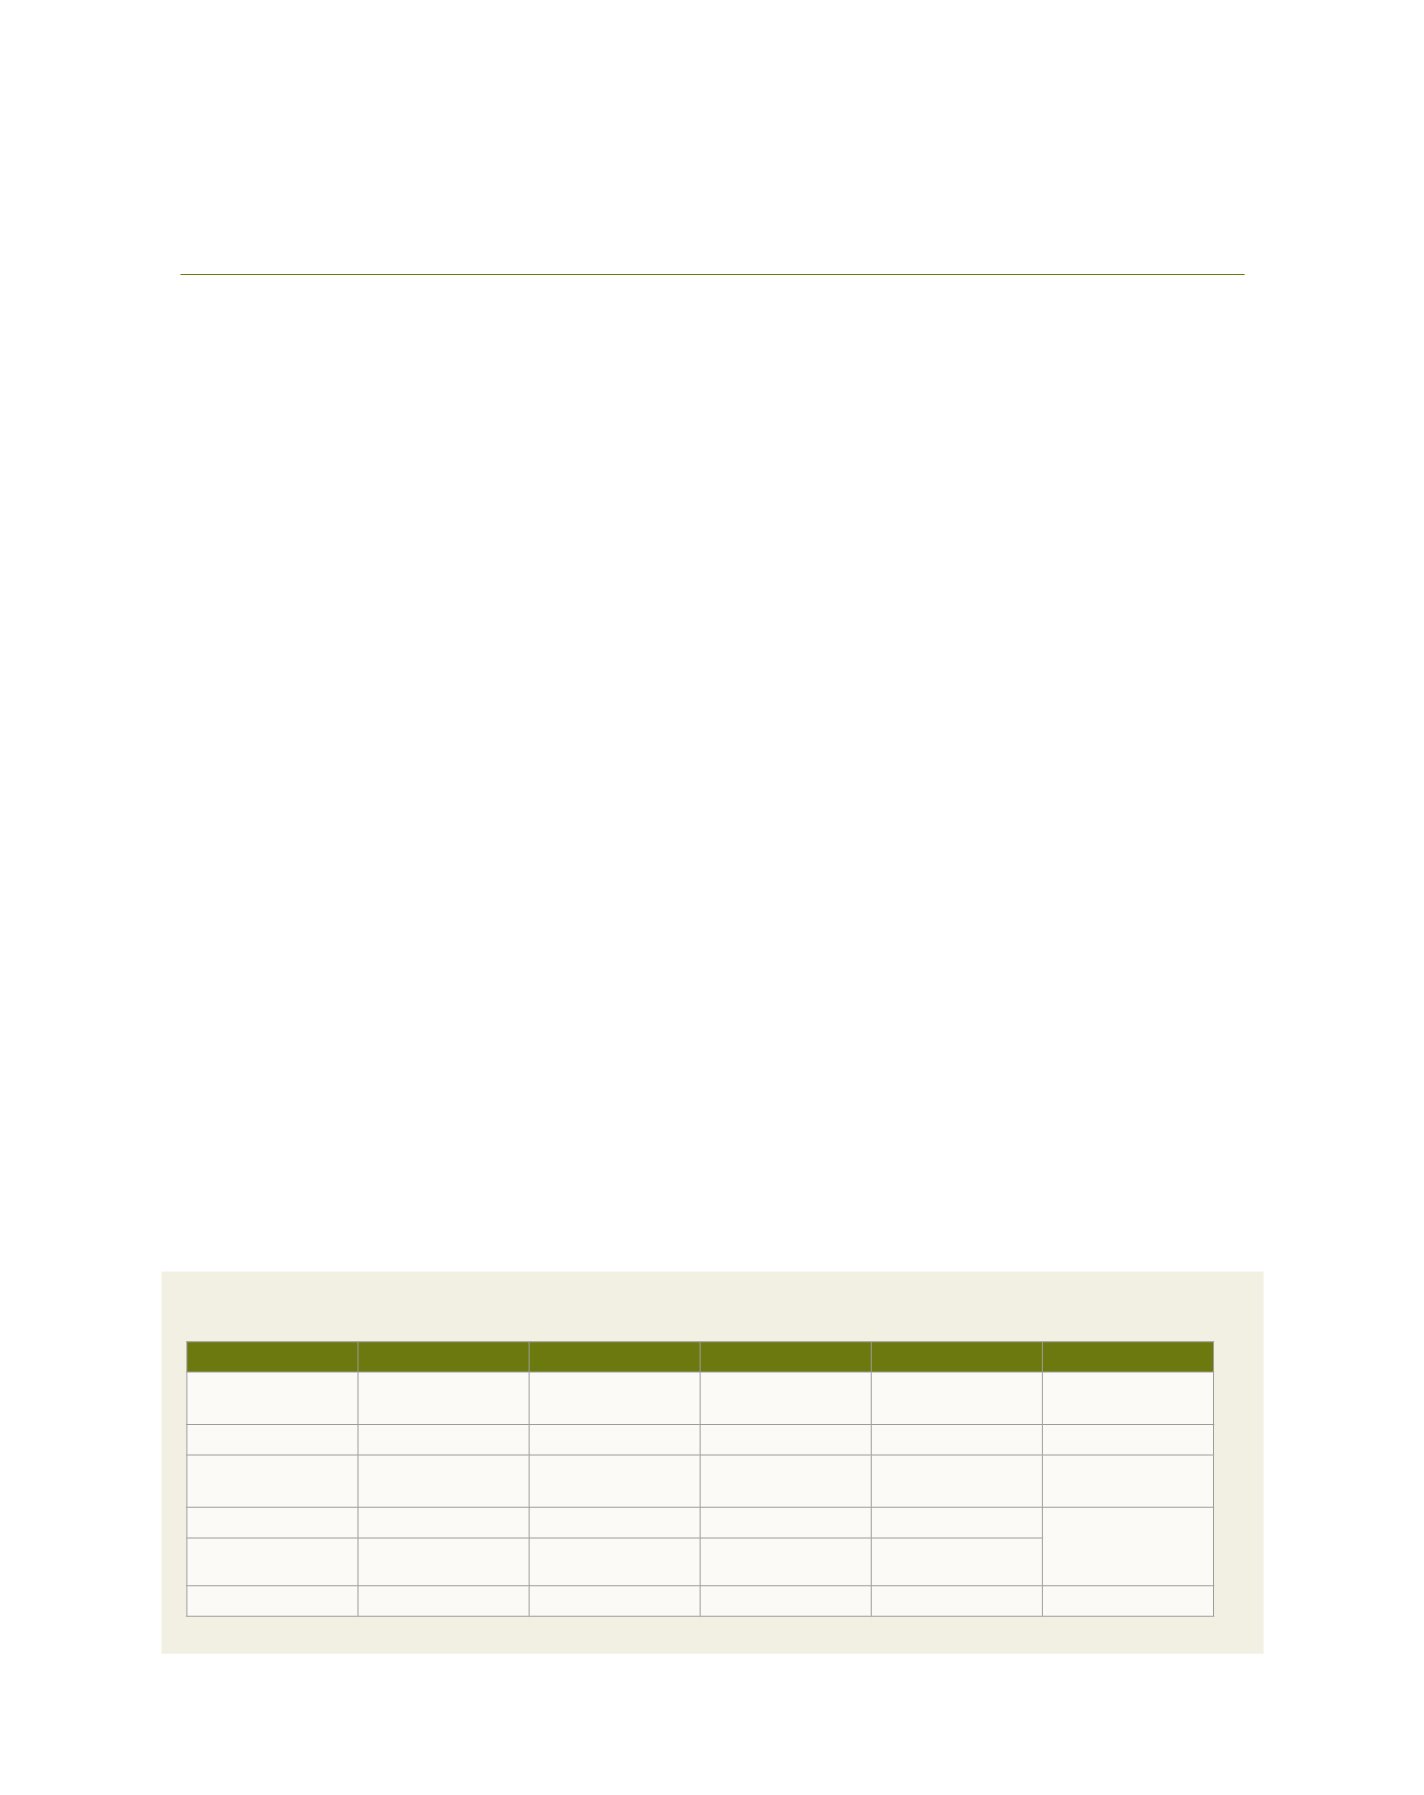
Phase
I
II
III
IV
V
Source location
Sarir – Tazerbu
Hasawnah (Murzuk
Basin)
South Kufra
Ghadames
Sirte
Status
Completed
Completed
Planned
Under construction Completed
Destination
Benghazi – Sirte
NW-coast, Misurata –
Tripoli – Jebel Nafusa
Tazerbu, to enhance
Phase I
Zwara and W-coast
to Zawia
Sedada
No. of wells
234
586
285
144
To connect Phase I
with Phase II
Daily production
(million m
3
)
2
2.5
1.68
0.246
Length (km)
1600
1676
383
621
190
Phases of the Great Manmade River project
Source: GWA


