


 98 / 130

[
] 98
A B
et ter
W
or ld
specifically in relation to the target to “implement integrated
water resources management at all levels” by 2030.
Preparation of the National Integrated Water Resources
Management Plan
(
NIWRMP) is largely based on the knowl-
edge base developed from thematic studies and expert
reviews of some 24 water management related topics, some
of which have been reported above. Additional desk studies
were also undertaken focusing on the extent to which the
states have committed to, and progressed in implement-
ing IWRM, since ownership is vested with respective state
governments as directed under the federal constitution.
An important feature of the plan preparation process
involving the many thematic studies is the formation of ASM
task forces to lead these studies. Each task force comprises
an ASM Fellow as the Chair, and co-opted subject matter
specialists drawn from the public/private/civil society sector,
and academia as members. The approach to each study is
multi-disciplinary and consultative through the engagement
of all relevant stakeholders from the public, private and civil
society sectors.
The NIWRMP is a synthesis of the strategies extracted
from the thematic and state level studies, organised in the
manner of an IWRM general framework originally developed
by the Global Water Partnership (GWP). It comprises four
discrete elements: enabling environment; institutional frame-
work; management instruments; and investments in water
infrastructure. For each category and strategy, a roadmap
is included for implementation over a 15-year timeframe
until 2030, the target year set by UN for the realisation of
the SDGs. The roadmap is formatted such that each discrete
element is split into two halves: Water as a Resource and
Water for Livelihood, targeting the achievement of balanced
development goals.
A total of 25 recommendations broken down into distinct
categories accompanies the NIWRMP. A summary of these
recommendations is appended below:
1
General
: A central recommendation calling for the
adoption and implementation of the NIWRMP, thereby
providing the stimulus to transform the water sector for a
better future. The plan’s components will be implemented
nationwide and concurrently by the key ministries and
respective state administrations.
2
Enabling environment
: Ten recommendations to address
policies, legislation, regulations and finance, among
which is the need for an over-arching Integrated Natural
Resources Policy; a contemporary National Water
Resources Act; and funding arrangements and proto-
cols, especially pertaining to environment rehabilitation
works.
3
Institutional framework
: Five recommendations that
focus on the review and strengthening of governance
through the institution of oversight and implementation
management structures at national, state, river basin and
local hierarchical levels, as well as a call for greater intra-
ministerial integration.
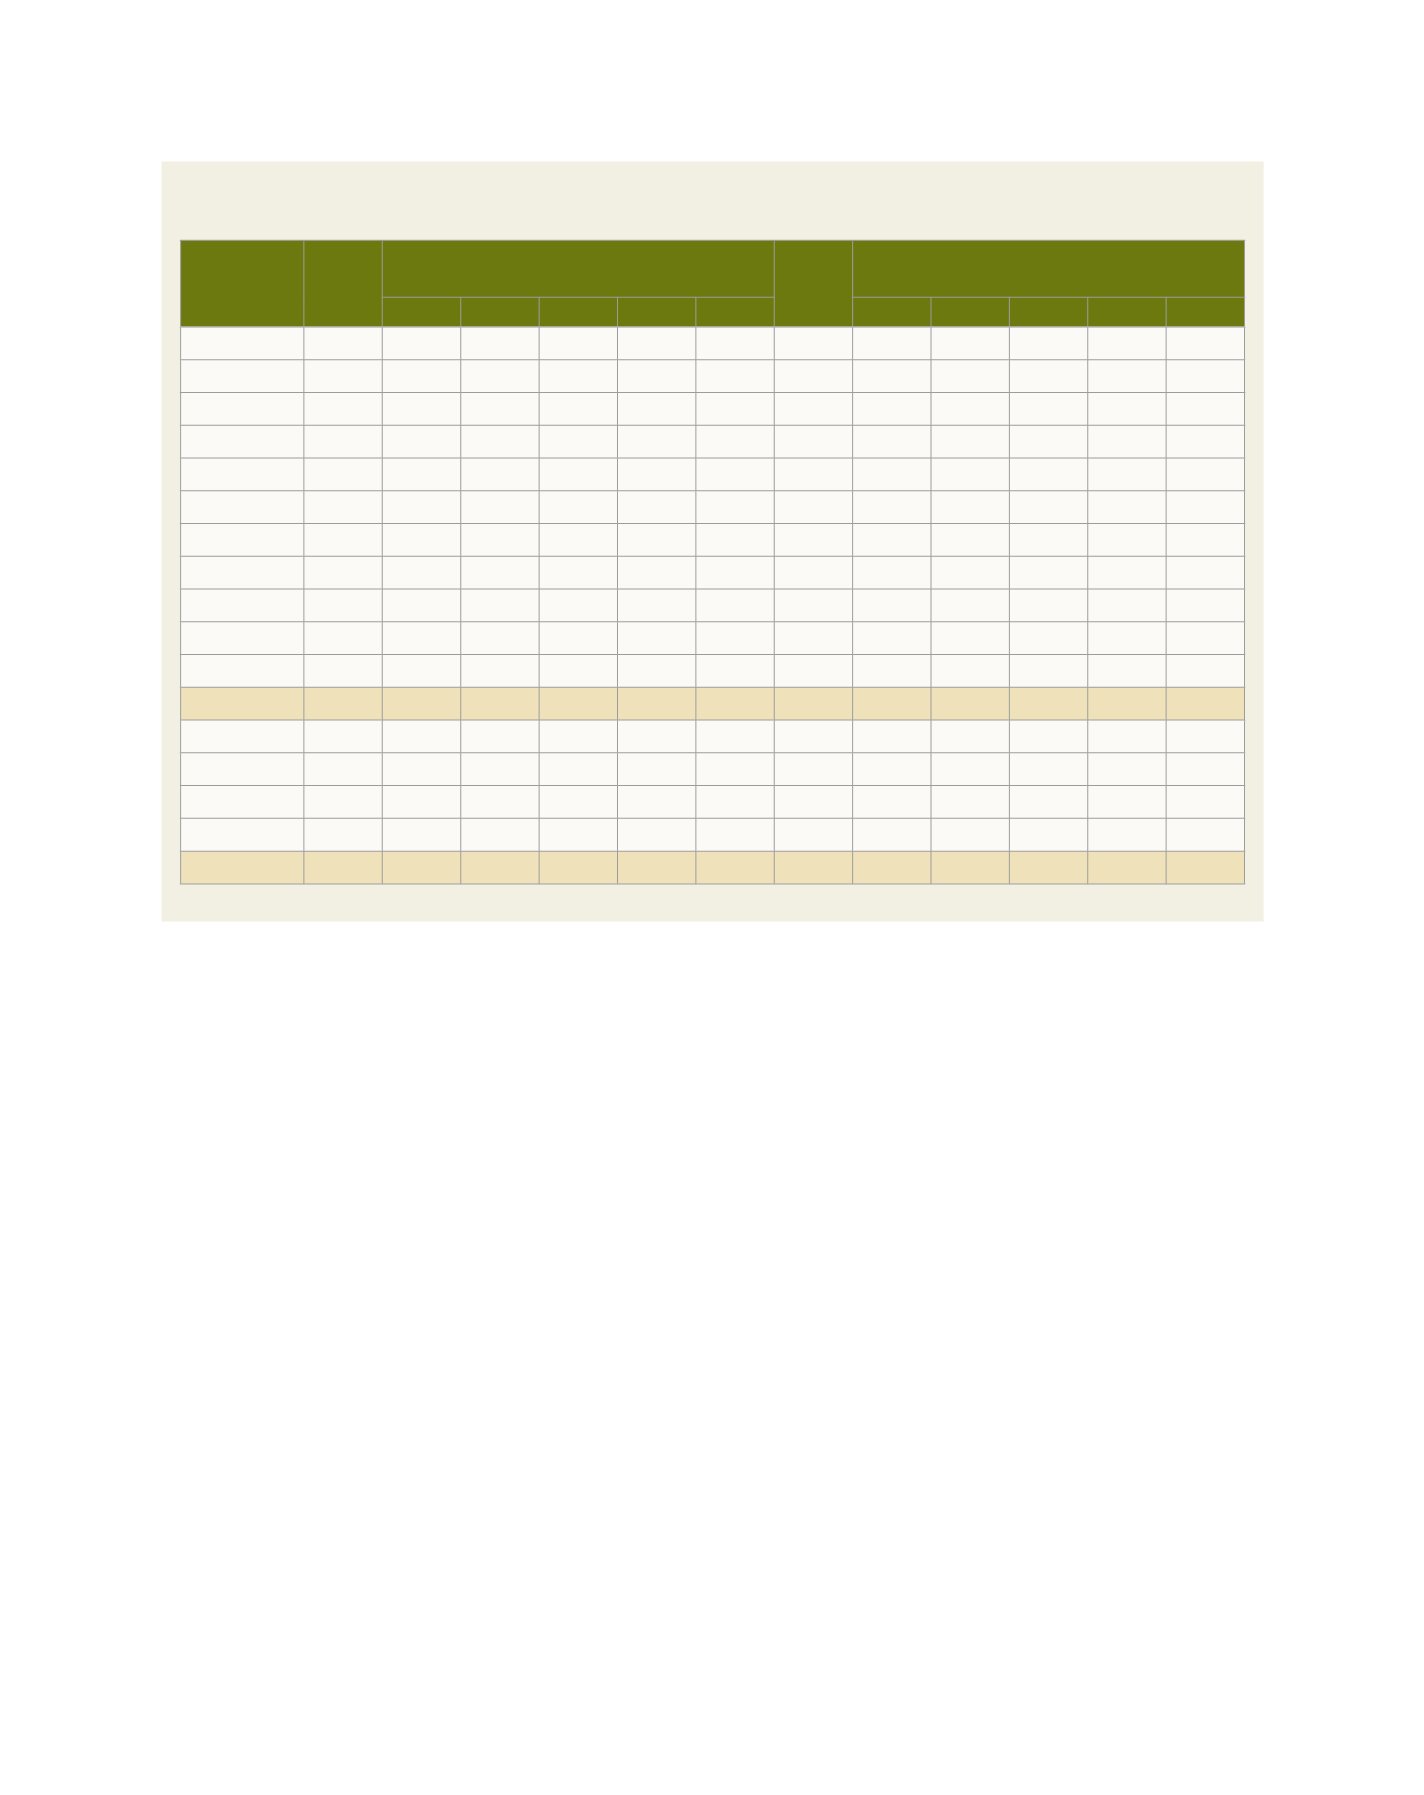
Total consumptive water demand against total surface water availability for all sectors
State
Land
area sq
km
Total consumptive water demand (MCM)
Effective
rain
(MCM/
year)
Excess/deficit (MCM) – unregulated flows
2010 2020 2030 2040 2050
2010 2020 2030 2040 2050
Source: National Water Resources Study, 2011
Perlis
821
306
299
286
284
281
60 (246)
(239)
(226)
(224)
(221)
Kedah
9,500 2,922 2,976 2,842 2,873 2,876 1,070 (1,852)
(1,906)
(1,772)
(1,803)
(1,806)
Pulau Pinang
1,048
765
829
835
874
894
130 (635)
(699)
(705)
(744)
(764)
Kelantan
15,099 1,632 1,619 1,586 1,600 1,604 2,650 1,018 1,031 1,064 1,050 1,046
Terengganu
13,035
884
975
970
999 1,026 3,310 2,426 2,335 2,340 2,311 2,284
Perak
21,035 1,949 1,923 1,798 1,801 1,811 3,140 1,191 1,217 1,342 1,339 1,329
Selangor
8,396 2,238 2,491 2,570 2,760 2,922
960 (1,278)
(1,531)
(1,670)
(1,800)
(1,962)
Pahang
36,137
726
946
897
911
959 6,460 5,739 5,514 5,563 5,549 5,501
Negeri Sembilan 6,686
340
361
358
366
374
640
300
279
282
274
266
Melaka
1,664
323
366
376
409
439
140 (183)
(226)
(336)
(269)
(299)
Johor
19,210
715
881 1,033 1,164 1,301 3,290 2,575 2,409 2,257 2126 1,989
Pen Malaysia 132,631 12,800 13,666 13,551 14,041 14,487 21,850 9,055 8,184 8,139 7,809 7,363
Sabah
73,631
912 1,356 1,392 1,442 1,469 16,210 15,298 14,854 14,818 14,768 14,741
Sarawak
124,450 1,054 2,162 2,125 2,175 2,247 27,440 26,386 25,278 25,375 25,265 15,193
WP Labuan
91
18
24
26
28
29
30
12
6
4
2
1
East Malaysia 198,172 1,984 3,542 3,543 3,645 3,745 43,680 41,696 40,138 40,197 40,035 29,935
Total Malaysia 330,803 14,784 17,208 17,094 17,686 18,232 65,530 50,751 48,322 48,336 47,844 37,298